
Profitability Reports
There are various profitability reports. Each report subtotals its information a different way (by job, by client, by AE, etc.), but all of them essentially draw their information from the same place.
Each report, if run with the same parameters (work date range, etc.), will produce the same grand total amount, just sub-total the body of the report differently based on the profitability report selected (Job Profitability, Client Profitability, etc.). These reports
show costs, time, expenses and billings from job tasks, not from the general ledger.
They provide the most inclusive way to track your shop's performance on jobs.
The foundation of the Job Profitability reports is the job task. Jobs track every cost and billing by job task.
Since job tasks are connected to jobs, which in turn are connected to clients, AE's and profit centers, they are an ideal basis
for analyzing profitability.
It's essential to understand the difference between the different types of date ranges used on these reports. When using the work date, it returns all costs and billings within that date range. When using the date added, start date, due date, or date closed, it returns all cost and billing task totals on jobs within that date range. In most cases, the job tasks themselves are hidden
to save space; what you see instead are just the job’s totals. So, one is looking as cost and billing detail and the other is looking at task totals on jobs. Therefore, know exactly what you are looking for before choosing a date range parameter. If you need a complete picture of a job, then use the date added, start date, due date, or date closed, if you just want to know all the costs and billings within a date range, even if it doesn't include all the costs and billings on the jobs displayed on the report, then use the work date.
However, for both date range types, costs and billings or task totals will be excluded for jobs outside of the production or billing status range chosen. Make sure the appropriate status code range is chosen to meet your information need. For example, if you want to see the performance on all jobs added in a given year that are now closed, then choose date added for that year, then make the to and from status code range the closed job status.
Dont confuse the Job Profitability and Client Profitability reports with the Job P&L and Client P&L under Snapshots > Financials. These reports are based on G/L journal entries from billings (posted A/R invoices), outside job costs (posted A/P invoices), and journal entries where a client code or job number were added to the entry. The Job P&L is printed for one accounting period, just like the agency’s income statement, not for a date range like the profitability reports. The Job and Client P&L's don't show time (captured in the G/L as overhead salary expense) or expense reports/internal charges (also captured in the G/L as overhead expenses), so they may be drastically different (and probably less accurate) then the profitability reports.
The gross margin reports show profit both before and after labor. Direct costs are the total vendor purchases, checks, and expenses. Net Revenue is billings less direct costs. Direct Labor are the total time costs. Profit is net revenue less direct labor.
Job profitability vs. the Agency's profitability
You can see profitability two ways: Job profit is focused on job costs -- vendor purchases, labor, job cost checks, and out-of-pocket expenses -- and job billings. Agency profit is based strictly on income and expenses for everything -- whether they impacted jobs or not.
You can’t rely on just one profit report to keep you informed. Job profitability and the income statement emphasize different things: job profitability reports are based solely on jobs, tasks, job costs and job billings; income statements are based soley on the general ledger.
Job profitability shows only costs and billings for jobs and tasks, and does not account for overhead expenses like rent. Income statements don’t reflect the cost of time spent working on jobs, only the total payroll overhead expense. Income statements take into account other non-job income, like fees and interest income; job profitability doesn’t reflect adjusting entries to the General Ledger.
What’s the difference between Gross Margin on profitability reports and the Net Income on the income statement?
Gross margin, as it is used in
Clients & Profits, is based on jobs and tasks.
It is the difference between a task’s billings
and its costs -- vendor purchases, time sheets,
and expenses. Net income, as it is used on the
income statement, is the agency’s real profit
after overhead expenses. The gross margin is better for analyzing job performance where the income statement is better for analyzing the agency's performance.
Job Profitability vs. the Job P&L
Both reports show important information about how well you’re
doing. Job profitability shows exactly where your revenue is being
earned, even better showing each client’s total contribution to profit than would the Client P&L (the Client P&L Analysis would be an exception since it attempts to accurately allocate overhead on the income statement to each client).
However, the
job profitability doesn’t include overhead -- so it’s
not a complete picture either. When used together, both reports
provide the complete picture you need to stay informed.
Differences
include:
Job Profitability
-- Job-based
-- Uses tasks to calculate totals
-- Shows job-to-date totals
-- Based on job start dates
-- Shows Income based on job billings
-- Shows labor based on cost rate
-- Reflects job cost transfers
-- Shows open POs
-- Can show profit by client, task, project, or job type
Job P&L
-- General Ledger-based
-- Uses G/L to calculate totals
-- Shows month-to-date account totals
-- Based on accounting periods (i.e., months)
-- Shows income on agency billings
-- Shows labor costs based on payroll
-- Doesn’t account for down time (includes down time as part of payroll)
-- Transfers don’t affect the G/L
-- POs aren’t reflected in job totals
Cost rates and profitability
Cost rates are important because they directly affect the job’s profitability.
Time sheets use cost rates to calculate the cost amount of labor automatically.
The total cost of each time sheet increases the job task’s cost amount
when time is posted. Costs rates are flexible, giving you complete control
over rates for each staff member. Carefully choosing resource cost rates is
an important and necessary step to make your profitability reports meaningful.
Each staff has his or her own individual cost rate. For flexibility, cost rates
are completely customizable. The staff’s cost rate is entered onto each
time sheet automatically, but can be changed.
What if you don’t use cost rates on time sheets? Your profitability reports
will be significantly affected. Your jobs will appear much more profitable,
which is wrong. The job’s cost totals would show only vendor purchases
and checks, and won’t reflect the value of your time. You’re not
required to use cost rates, however. But if you don’t, be consistent --
don’t use cost rates on any time for any job. And just be aware that when
you look at a profitability report, the total profit doesn’t include labor.
Unbillable jobs and job profitability
Unbillable jobs can be included on the gross margin report
if they have the same selections (billing status and start date)
as other jobs. It’s a good idea to include these jobs on the
report, since it makes your client totals more realistic. Your
total billings, costs, and margin for clients will be more accurate,
since the cost of the unbillable jobs will be included.
To see the most accurate job totals, you should include your agency overhead
jobs as well. To include these jobs, make sure they have a billing status and
a start date. When you print a profitability report, enter the billing status
that includes your agency jobs as well as the billable client jobs.
Job costing and profitability
It is important to be consistent about how you track job costs.
On profitability reports, the cost total includes all vendor purchases,
time sheets (using the resource’s cost rates), expenses, and
checks written for job costs. The cost total is the total amount
you’ve spent to complete the job (so far). If you don’t
include all costs that you really incurred for a job, then your
cost total will be too low -- and the job’s profit will be
overstated. Likewise, if you don’t enter time with accurate
cost rates, the cost total won’t include the cost of the labor
used to complete the work -- and the job’s profit will be
too high.
Profitability Reports |
|
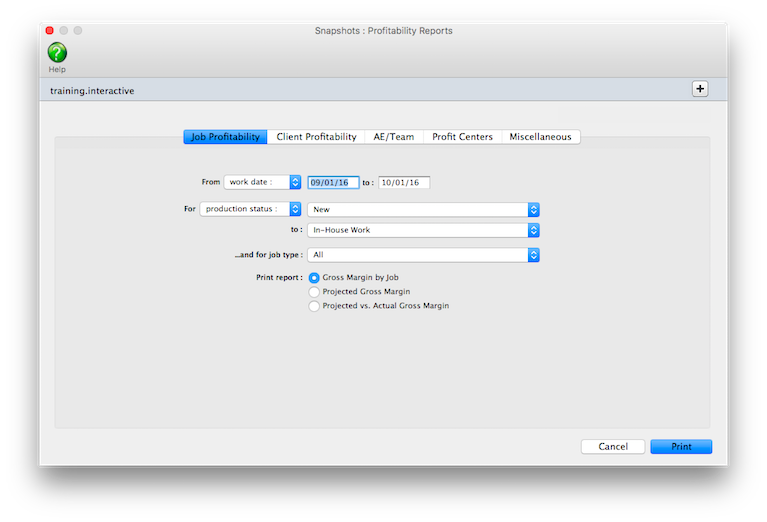
Job Profitability |
|
Gross Margin by Job |
The Gross Margin by Job report compares costs and profit for each job, subtotaled by job type. The net revenue is calculated based on the billings less direct costs, and the gross margin (or profit) is calculated by the net revenue less direct labor costs. |
Projected Gross Margin |
The Projected Gross Margin report calculates a projected gross margin based on the job’s estimate less the costs expected to be incurred to complete the job (i.e., budget). |
Projected vs. Actual Gross Margin |
The Projected vs Actual Gross Margin report compares the job’s actual gross margin to the projected gross margin. The job’s are subtotaled by job type. |
Client Profitability |
|
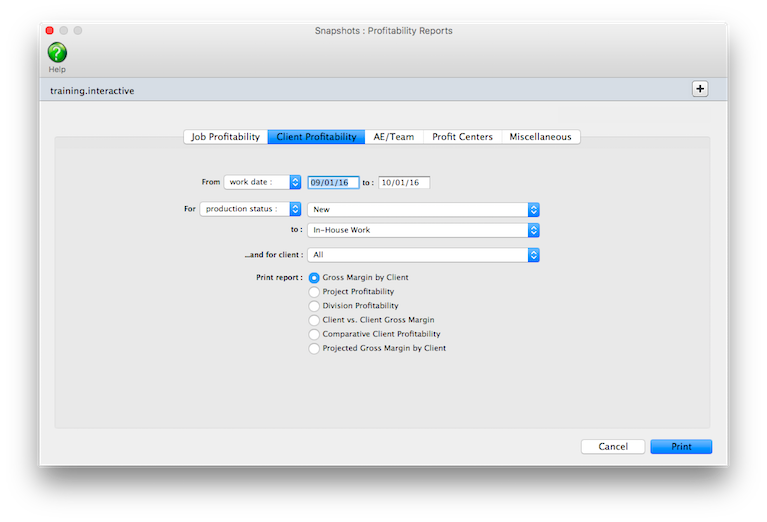
Gross Margin by Client |
The Gross Margin by Client report shows the net revenue for every client’s jobs. |
Project Profitability |
The Project Profitability report compares gross margin for jobs within each project. |
Division Profitability |
The Division Profitability report compares profit between divisions and their clients. |
Client vs. Client Gross Margin |
The Client vs Client Gross Margin report shows the costs and profit for each client and calculates each client’s net revenue and gross margin. |
Comparative Client Profitability |
The Comparative Client Profitability report compares this year’s and last year’s profit. |
Projected Gross Margin by Client |
The Projected Gross Margin by Client report calculates a projected gross margin based on the job’s estimate less the costs expected to be incurred to complete the job (i.e., budget) and the jobs are subtotaled by client. |
AE/Team |
|
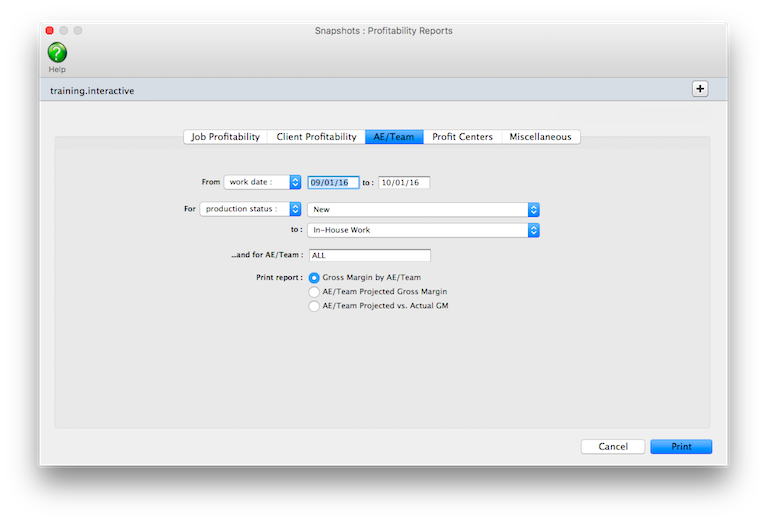
Gross Margin by AE/Team |
The Gross Margin by AE/Team report calculates the net revenue and gross margin for each job and subtotals the jobs by AE/Team. |
AE/Team Projected Gross Margin |
The AE/Team Projected Gross Margin report calculates the projected gross margin based on the job’s estimate less its budget. The job’s are subtotaled by AE/Team. |
AE/Team Projected vs. Actual Gross Margin |
The AE/Team Projected vs Actual Gross Margin report compares the projected gross margin to the actual gross margin for each job and subtotals the jobs by AE/Team. |
Profit Center |
|
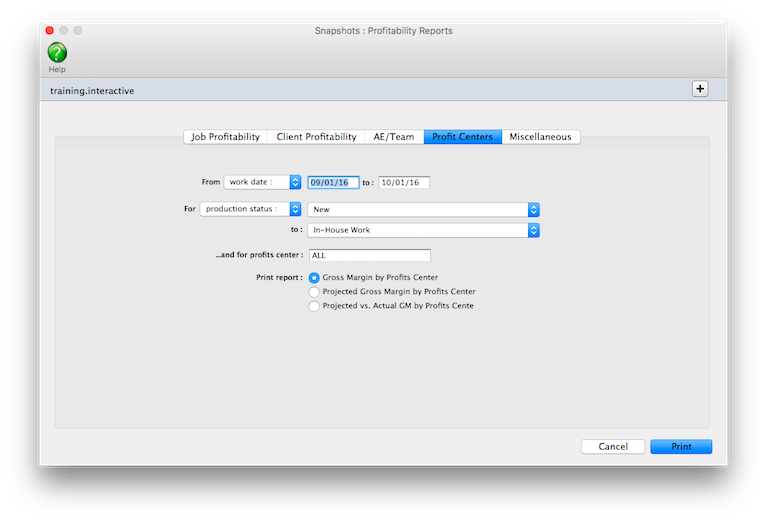
Gross Margin by Profit Center |
The Gross Margin by Profit Center report calculates the net revenue and gross margin for each job and subtotals the jobs by client, then by profit center. |
Profit Center Projected Gross Margin |
The Profit Center Projected Gross Margin report calculates the projected gross margin figure for each job based on the projected billings (the job’s estimate) less the costs expected to be incurred to complete the job (the job’s budget). The job’s are subtotaled by client, then by profit center. |
Profit Center Projected vs. Actual Gross Margin |
The Profit Center Projected vs Actual Gross Margin report compares the projected gross margin to the actual gross margin for each job and subtotals the jobs by client and PC. |
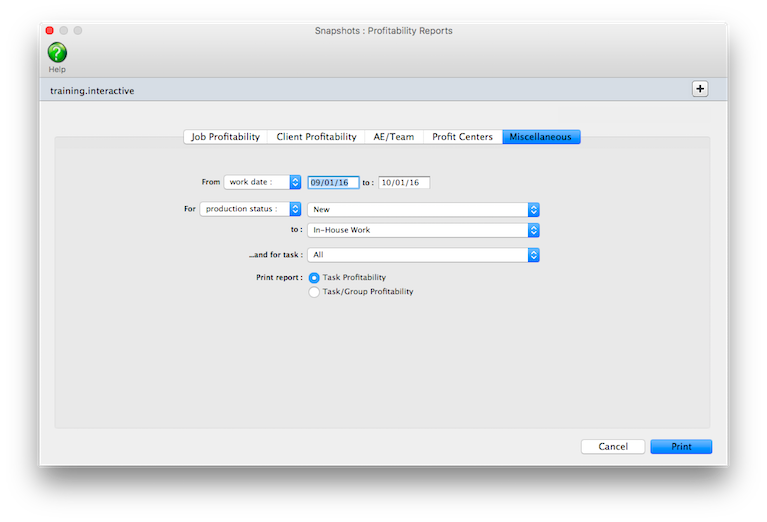
Miscellaneous |
|
Task Profitability |
The Task Profitability report compares profit by client for each task. |
Task/Group Profitability |
The Task/Group Profitability report shows profit earned by each task and group. |

© 2026 Clients & Profits, Inc.